Contents
- Set Functions
- BioMaps
- Sungear
- Finding Differentially Expressed Genes
- Network Statistics
- Gene Networks ( Cytoscape )
Set Functions
Allows you to do set functions on gene sets(union, intersection, and symmetric difference). Choose groups and use the pulldown Analysis menu to select which function you would like.
Union
The Union operation allows you to combine two or more gene
sets into a new set consisting of all of the genes in those sets. The
union operation does not add the same gene more than once to the new
set; as a result, the sum of the number of genes in the original sets
may be greater than the number of genes in the union.
Intersect

Figure 1: Intersect
The Interesect operation gives you those genes
shared by all selected sets. Only those genes shared by the selected
sets will appear in the new set. Figure 1 shows a Venn diagram
illustrating the component that appears in the Intersect.
Symmetric Difference

Figure 2:
Symmetric Difference
The symmetric difference is the union of the sets minus the intersect.
It represents those genes that only appear in one of the
selected sets, and do not appear in any other. An example
Venn diagram is shown in Figure 2.
Functional Annotations
- Biomaps
- Sungear
- Go Pie
BioMaps
BioMaps is useful for identifying which functional terms (GO or MIPS functional terms) are enriched in a gene set. It takes one or more set of genes as input and compares the associated functional terms to a background population (e.g. Arabidopsis genome).To Begin, click on the Analyze link:

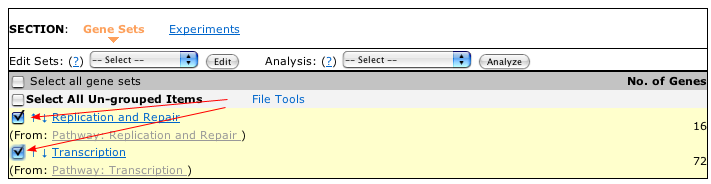
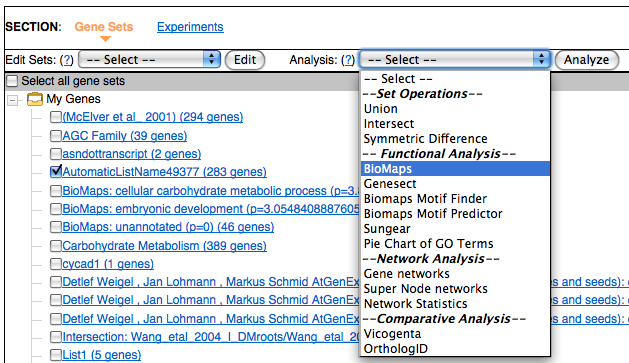
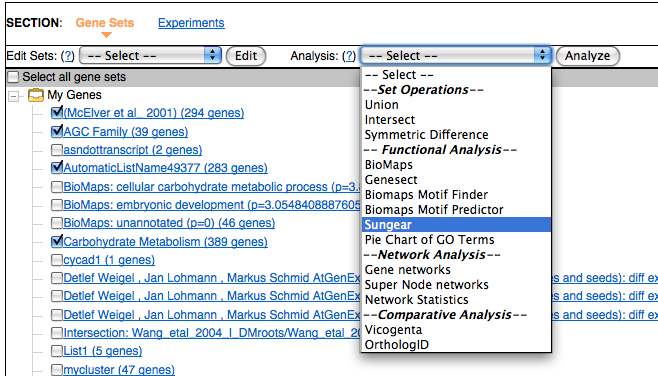
Select the gene list or gene lists by selecting the checkbox in front of your genes in the main view. In the Analysis pull down menu select BioMaps and then click on the Analyze button.
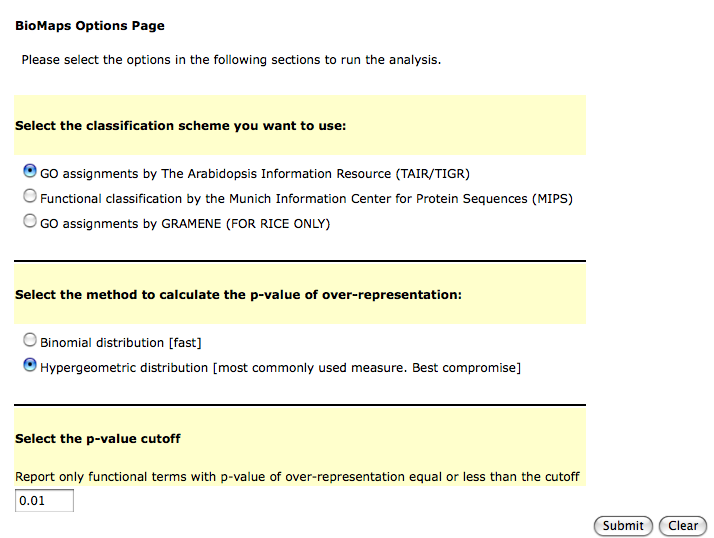
This will take you to a form where you can select the term you want to use in your analysis and also the statistics and the p-value cutoff.
When the analysis is complete you will provided links to different ways of looking at the data.
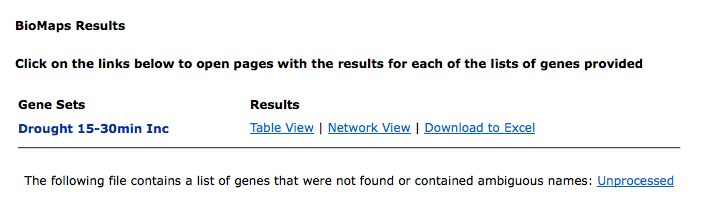
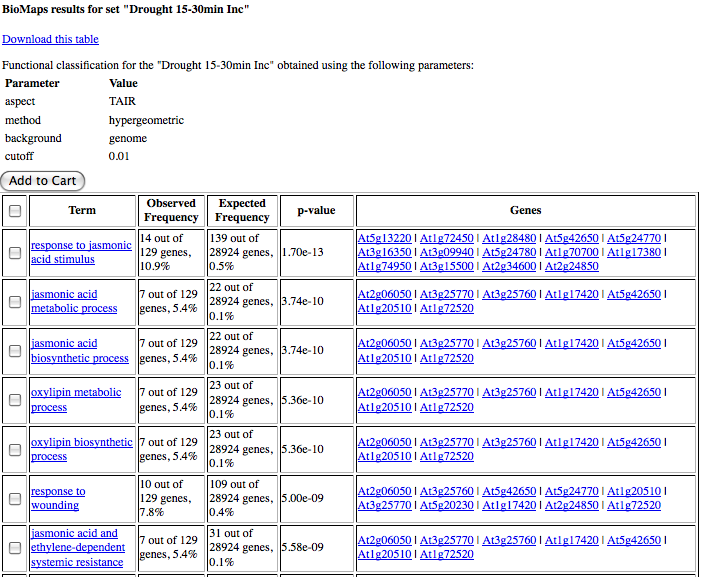
The table output lists the GO terms that are over-represented and the genes annotated to this term along with AGI code for the genes and the p-value. If you would like to save the list of genes associated to a go-term in the table, simply select the checkbox near the go term and click on Add to Cart
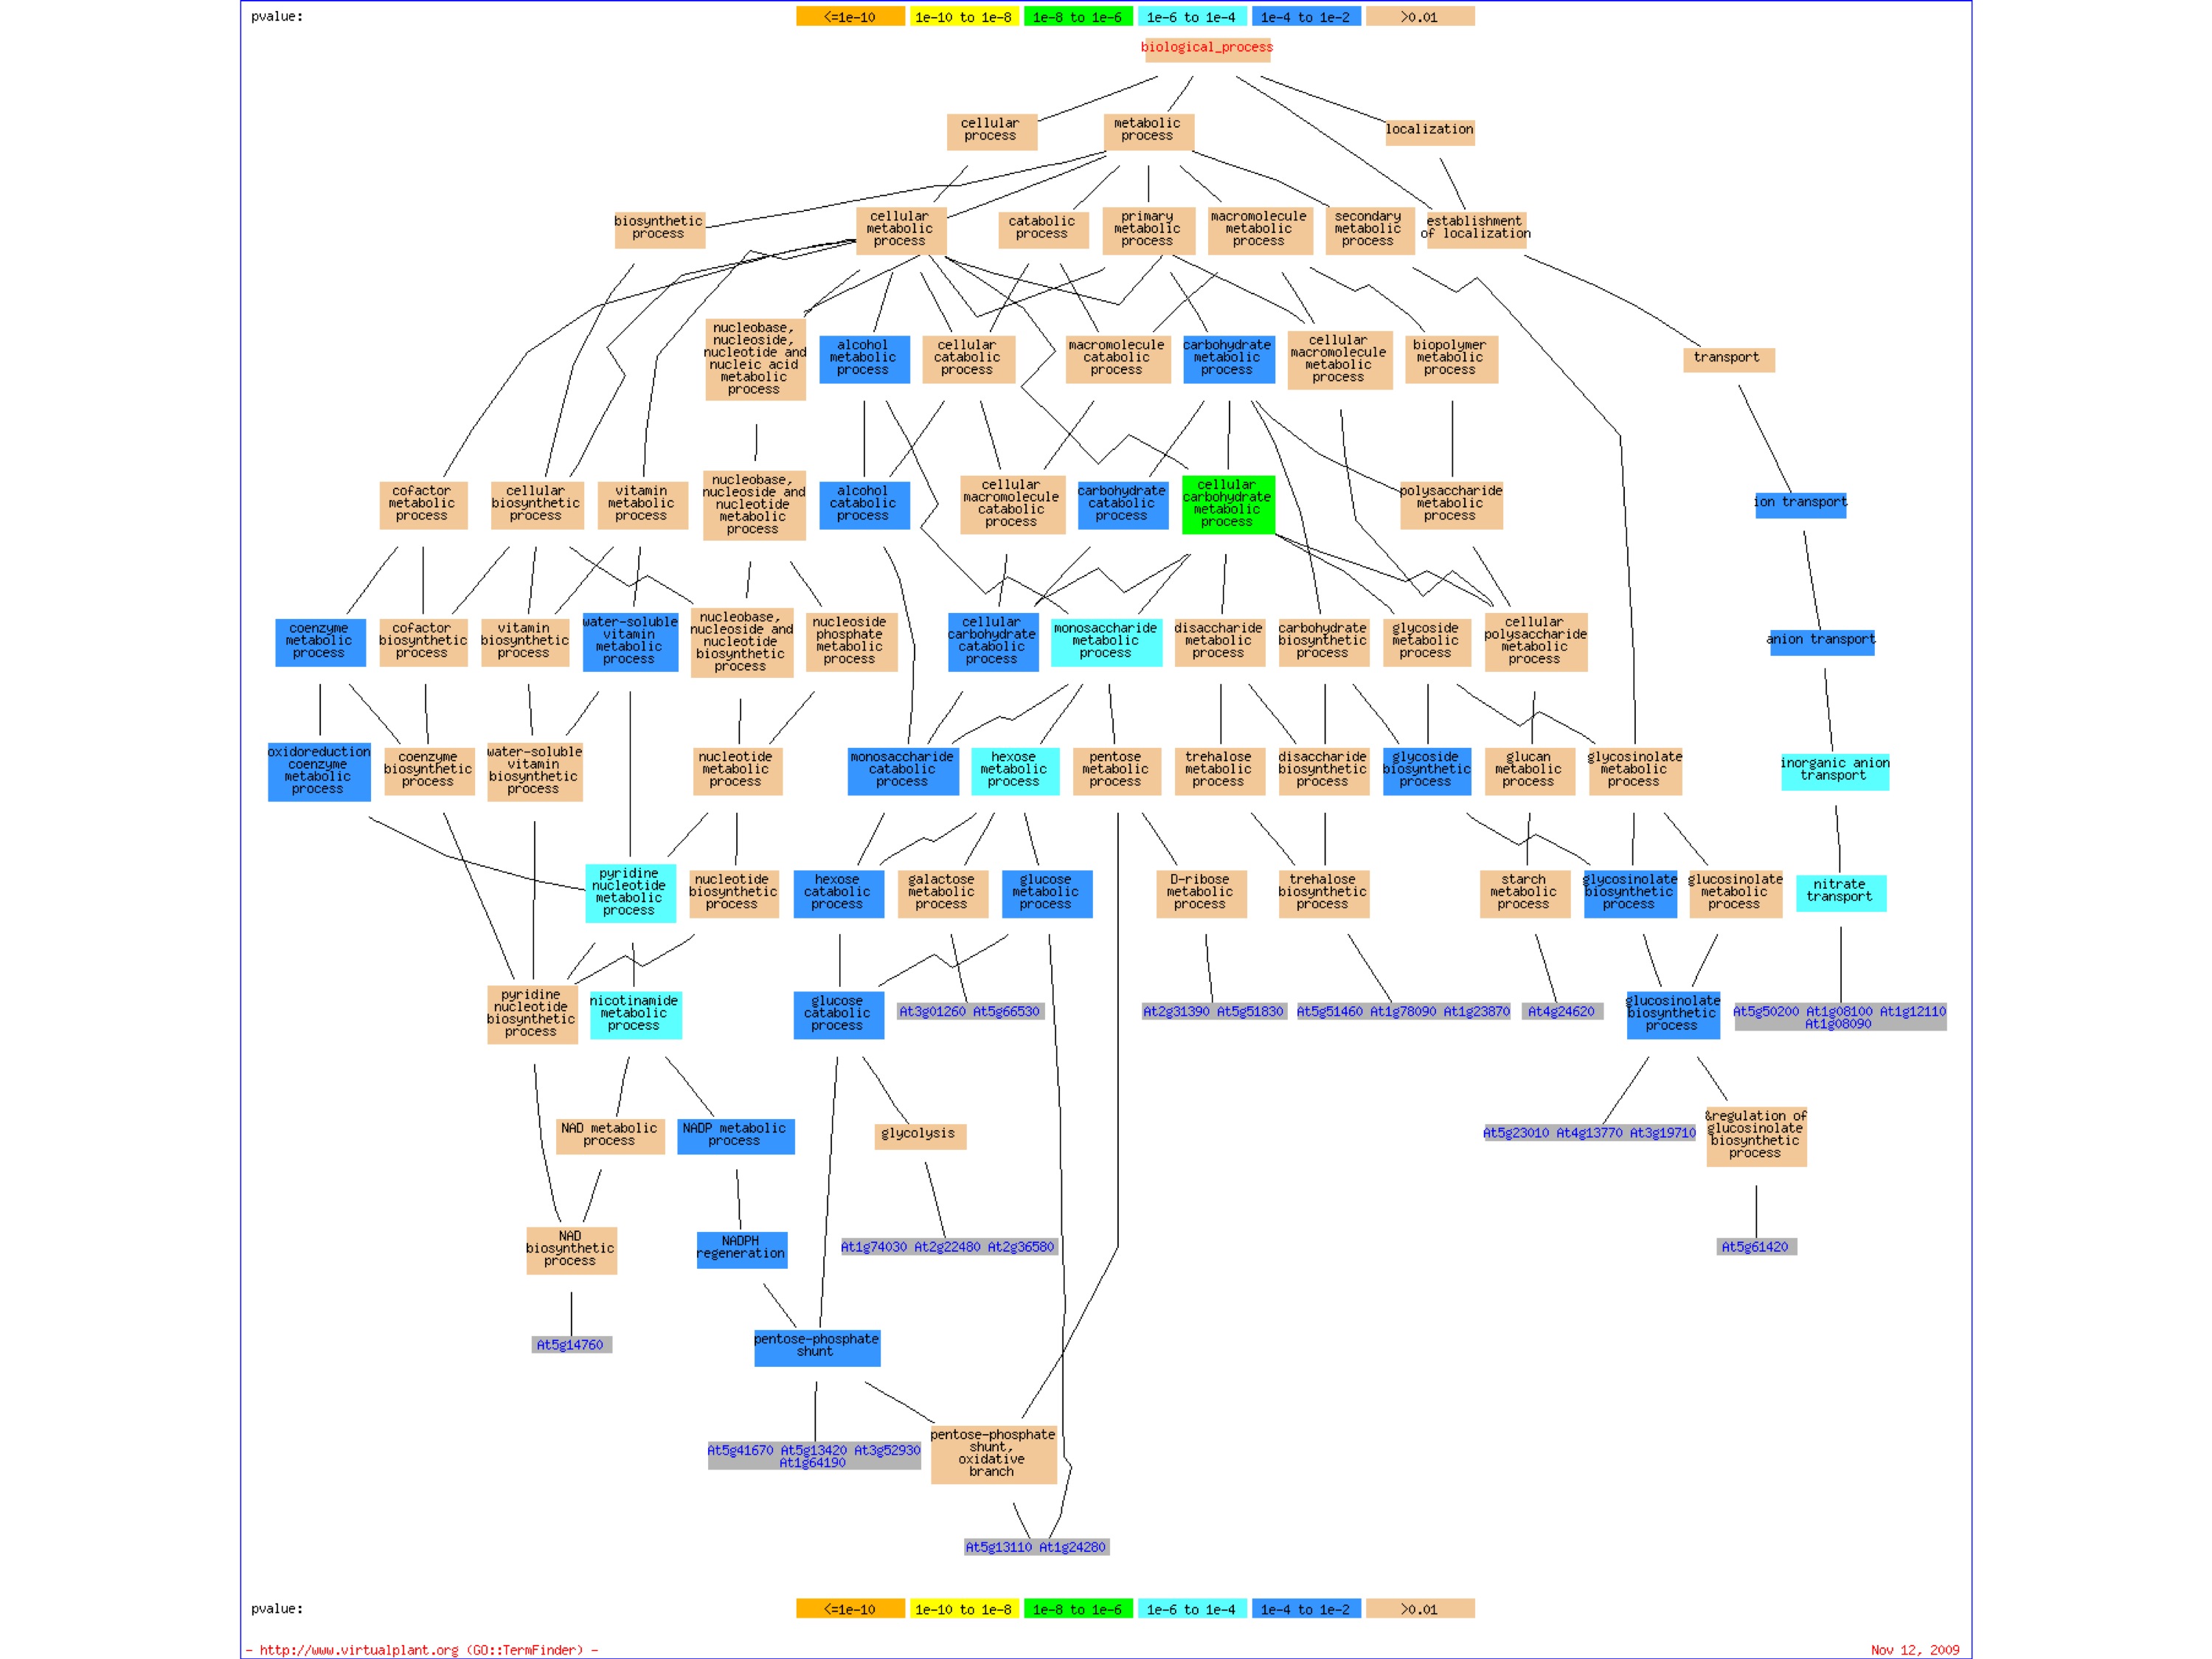
In addition, a graphical output is presented that shows GO terms as nodes in a graph, with the relevant genes attached to them. These genes can be added to the gene cart. Here the graph represents the GO-heirarchy and the nodes of the graph are color coded based on the p-value.
The Download link will allow you to save the table on your local computer and open it directly with Excel or any other spreadsheet.
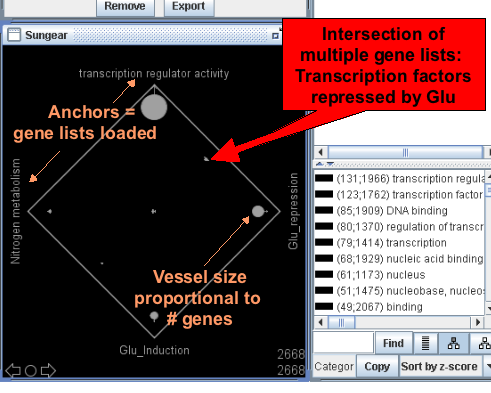
Sungear
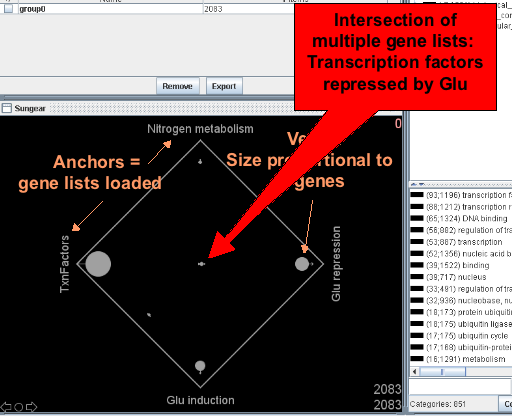
Sungear is a visualization tool that allows an interactive exploration of many experiments at a genomic scale. To use Sungear simply choose which gene sets you would like to analyze and select Sungear from the Analysis drop down.
Sungear is a powerful tool and it might be helpful to read the documentation to best use it.
Finding Differentially Expressed Genes
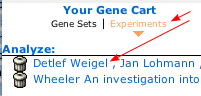
Clicking on one of your experiments will allow you to find differentially expressed genes.
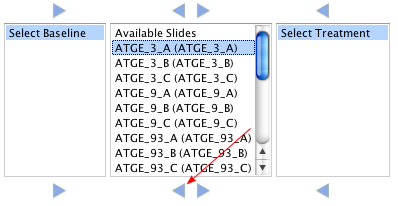
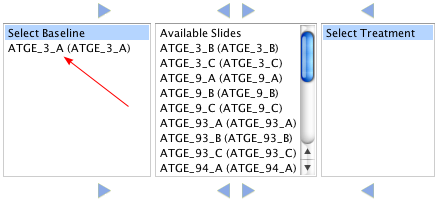
Assign Samples
Samples should be assigned to either baseline or treatment sets. Samples not assigned to either set will not be analyzed. To assign a sample to a set first choose the sample, then click the arrow to move it to the appropriate group. In the example below the Sample ATGE_3_A (ATGE_3_A) was moved to the basline set.
Enter Email
Often times this analysis can take some time so an email will be sent when completed. You can also return to this page to view the current progress of the analysis.
Choose Statistical Functions
To select a list of differentially expresed genes you have to choose a statistical analysis.
- If log base 2 ratio, the test is simply based in the ratio of treatment vs baseline.
- If t-test (BH), the tests are based on two-sample t-test and p-values are corrected using the Benjamini and Hochberg method to control the false discovery rate (FDR). FDR is the expected proportion of false discoveries amongst the rejected \ hypoheses. The false discovery rate is a less stringent condition than the familiy wise error rate, so this method is more powerful than the others.
- If t-test (multtest), the tests are based on two-sample Welch t-statistics (unequal variances).
- If wilcoxon (multtest), the tests are based on standardized rank sum Wilcoxon statistics.
- If paired t-statistic (multtest), the tests are based on paired t-statistics. The square of the paired t-statistic is equal to a block F-statistic for k=2.
Choose Cutoff
To select a list of differentially expresed genes you have to define a cutoff. Use a log base 2 number to filter ratio values (e.g. 1 for 2-fold change). Please note that this function will select genes with an absolute log base 2 ratio greater or equal than the cutoff (i.e. regulated genes as defined by a fold change cutoff). Replicates are averaged when using the ratio. Enter a p-value cutoff (e.g. 0.01) when using any of the statistical functions: t-test, Wilcoxon, F-statistics, Paired t-statistics.
Network Statistics
Gene Networks(Cytoscape)
The GeneNetwork function creates a network graph using data from several different sources. You can Select the type(s) of \ information you would like to use to create the graph. Where possible, the categories have been further categorized by Sub-type an\ d evidence to give the user more control over the source of information to use for drawing the graph.
- Enzymatic reaction : KEGG and AraCyc metabolic information.
- Transcriptional regulation : Regulatory information i.e., Transcription Factor to target gene information from AGRIS, Transfac.
- Protein:Protein interactions : Protein interaction data from BIND. Predicted protein:protein interactions based on homology (interologs).
- Post-transcriptional regulation : miRNA target predictions.
- Literature based interactions: Gene interactions based on Geneways (a text mining tool)
- Binding site over-representation : Damion Nero et al. (BMC Bioinformatics
2009, 10:435) searched for predicted binding sites of transcription factor
families.
One : the target gene contains at least one binding site for the transcription factor.
Three : one of the binding sites is over-represented (greater than three standard deviations). - Correlated edges : Significant correlation of edges based on an e-value cutoff of 0.01. The correlation data is drawn from the user selected experiment. To select this option the user must have previously uploaded an experiment to their cart.
NOTE: If you enter a correlation value without selecting a Category to limit, your network will include all correlated edges in your gene-set as determined by their expression in your experiment.